library(igraph)
library(foreach)
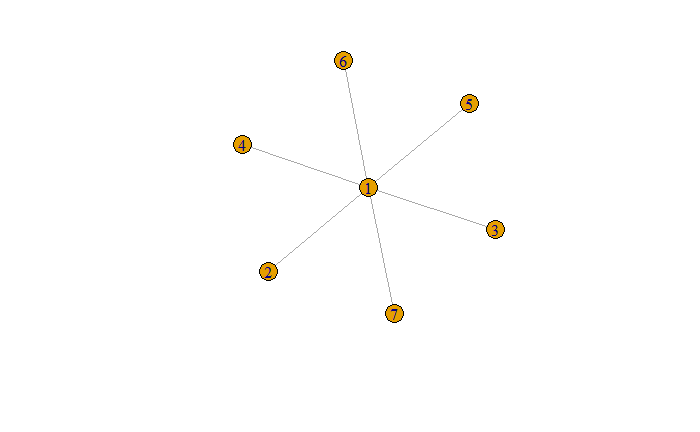
from <- rep(1,6)
to <- c(2:7)
edgelist <- data.frame(form=from, to=to)
star <- graph_from_data_frame(edgelist, directed = F)
plot(star)Confidence clustering
social network analysis
Archive URL: http://web.archive.org/web/20200301160639/http://oskarkosch.com/blog/confidence-clustering/
Clustering is usually done with the objective of modularity maximization (e.g., the so-called Louvain algorithm), sometimes with additional constraints (like the Leiden algorithm). But, what is somewhat bizarre, these algorithms are very broad in terms of what they aim to partition, and therefore, are superficial in their interpretation – if one tool is used to fit all needs… then it rather should be used on exploratory stage of research, when the nature of the network and possible insights are yet to be determined.
Here I propose an early version of clustering based on neutrality centrality and few assumptions. The implementation now is a little dirty and should get better with the next versions. Also, please note, that neutrality centrality here is calculated as standard deviation of population, not sample (that explains differences in values when compared to the previous post).
The assumption is that more confident nodes are convincing less confident ones. So this algorithm tries to create clusters based on structural bias. This approach might be especially useful in social network analysis of political sympathies, or separate areas of discrimination in localization of the public utility facilities. It should be noted that in terms of modularity, it will never achieve results the modularity-based algorithms do; on the other hand, it has the potential to become lightweight.
Few things are yet to be implemented:
the exclusion of extremists from the confidence network of mainstream nodes (probably this occurs), the
extremists_populationvariablethe influence of the neighbors as a whole, rather than individuals
Also, this kind of clustering, by implementing assumptions, needs to be yet validated – and by this fact it is different from the other, more generic algorithms. While working on making this algorithm better, I will try to provide layout creating algorithm based on structural bias and rotation of nodes.
Confidence partitioning algorithm
prob_bool <- function(t_prob) {
  sample(c(T,F),1,prob=c(t_prob,1-t_prob))
}

clean.g.attributes <- function(graph) {
  for(e in setdiff(vertex_attr_names(graph),'name')) {
    graph <- delete_vertex_attr(graph, e)
  }
  for(e in edge_attr_names(graph)) {
    graph <- delete_edge_attr(graph, e)
  }
  for(e in graph_attr_names(graph)) {
    graph <- delete_graph_attr(graph, e)
  }
  return(graph)
}

vertices_ids <- function(graph) {
  if(is.named(graph)) {
    names <- get.vertex.attribute(graph,'name')
  } else {
    names <- 1:vcount(graph)
  }
  return(names)
}

centr_neutr <- function(graph, moment=2) {
  graph <- clean.g.attributes(graph)
  names <- vertices_ids(graph)
  global.length <- length(names) - 1
  centralities <- foreach(e = names, .combine = 'c') %do% {
    to <- setdiff(names, e)
    dists <- distances(graph, e, to)
    mn <- mean(dists)
    res <- (sum((dists-mn)^moment)/(global.length))^(1/moment)
    # res <- sd(dists)
    return(res)
  }
  names(centralities) <- names
  return(centralities)
}

centr_neutr(star)| 1 | 2 | 3 | 4 | 5 | 6 | 7 |
| 0.000000 | 0.372678 | 0.372678 | 0.372678 | 0.372678 | 0.372678 | 0.372678 |
cluster_confidence <- function(graph, extremists_population=0, merge_same_level=.0, lonely_join_neighbours=.0, cent=NULL) {
names <- vertices_ids(graph)
if(is.null(cent)) {
cent <- centr_neutr(graph)
}
extremists <- cent %>% sort(T) %>% {.[0:extremists_population]} %>% names()
memb <- vector('character', length(cent))
names(memb) <- names
from <- to <- c()
comps <- graph.empty(n=0, directed=F)
comps <- add_vertices(comps, length(names), name=names)
for(i in 1:length(names)) {
nm <- names[i]
nei <- as.character(neighbors(graph, nm))
nei_cent <- cent[nei]
if(any(cent[nm]<nei_cent)) {
comps <- add_edges(comps, c(nm, nei[which.max(nei_cent)]))
} else if(merge_same_level>0&any(cent[nm]==nei_cent)&prob_bool(merge_same_level)) {
comps <- add_edges(comps, c(nm, nei[which.max(nei_cent)]))
} else if(lonely_join_neighbours>0&prob_bool(lonely_join_neighbours)) {
comps <- add_edges(comps, c(nm, nei[which.max(nei_cent)]))
}
}
cmps <- components(comps)
return(cmps$membership)
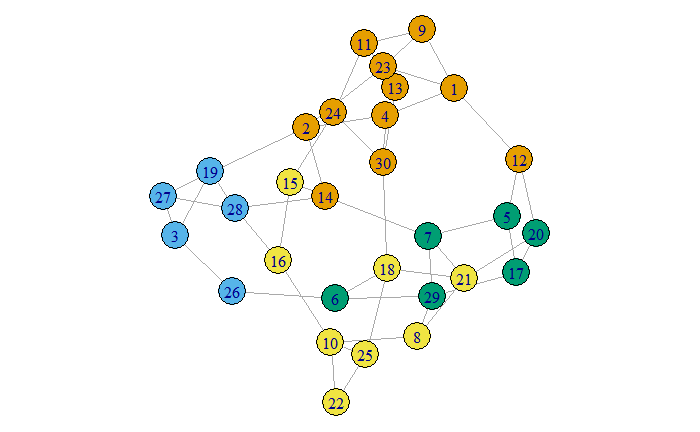
}sample_deg <- sample_degseq(sample(c(2,3,3,4),30,T)) %>% simplify()par(mar=rep(0,4))
plot(sample_deg, vertex.color=cluster_confidence(sample_deg,0,1,1))